
I had a simple question — how much am I actually spending on Swiggy every month?
Not a rough guess. Not a “feels like a lot.” I wanted actual numbers. Food orders, Instamart groceries, the taxes I never think about, the handling fees I always ignore. All of it.
Turns out, getting that answer was harder than I expected. And the answer itself? ₹1.14 Lakhs in 6 months. That number alone made the whole exercise worth it.
The Question That Started It All
A few months ago, I was looking at my bank statement and noticed a pattern. Swiggy charges here, Swiggy charges there — small amounts that individually look harmless but add up over time. I started wondering:
- What’s my actual monthly spend on food delivery vs groceries?
- Am I ordering too frequently? Could I batch my Instamart orders to twice a month and save on delivery charges and handling fees?
- How much am I paying in taxes without realizing it?
- Which restaurants am I spending the most at?
Pretty basic questions, right? I figured Swiggy would have some kind of analytics page or at least an option to export my order history. A spending summary, a CSV download — anything.
Nope.
The Limitation
Swiggy doesn’t offer any analytics dashboard for your spending. There’s no CSV export. No API. No way to download your order history in a structured format.
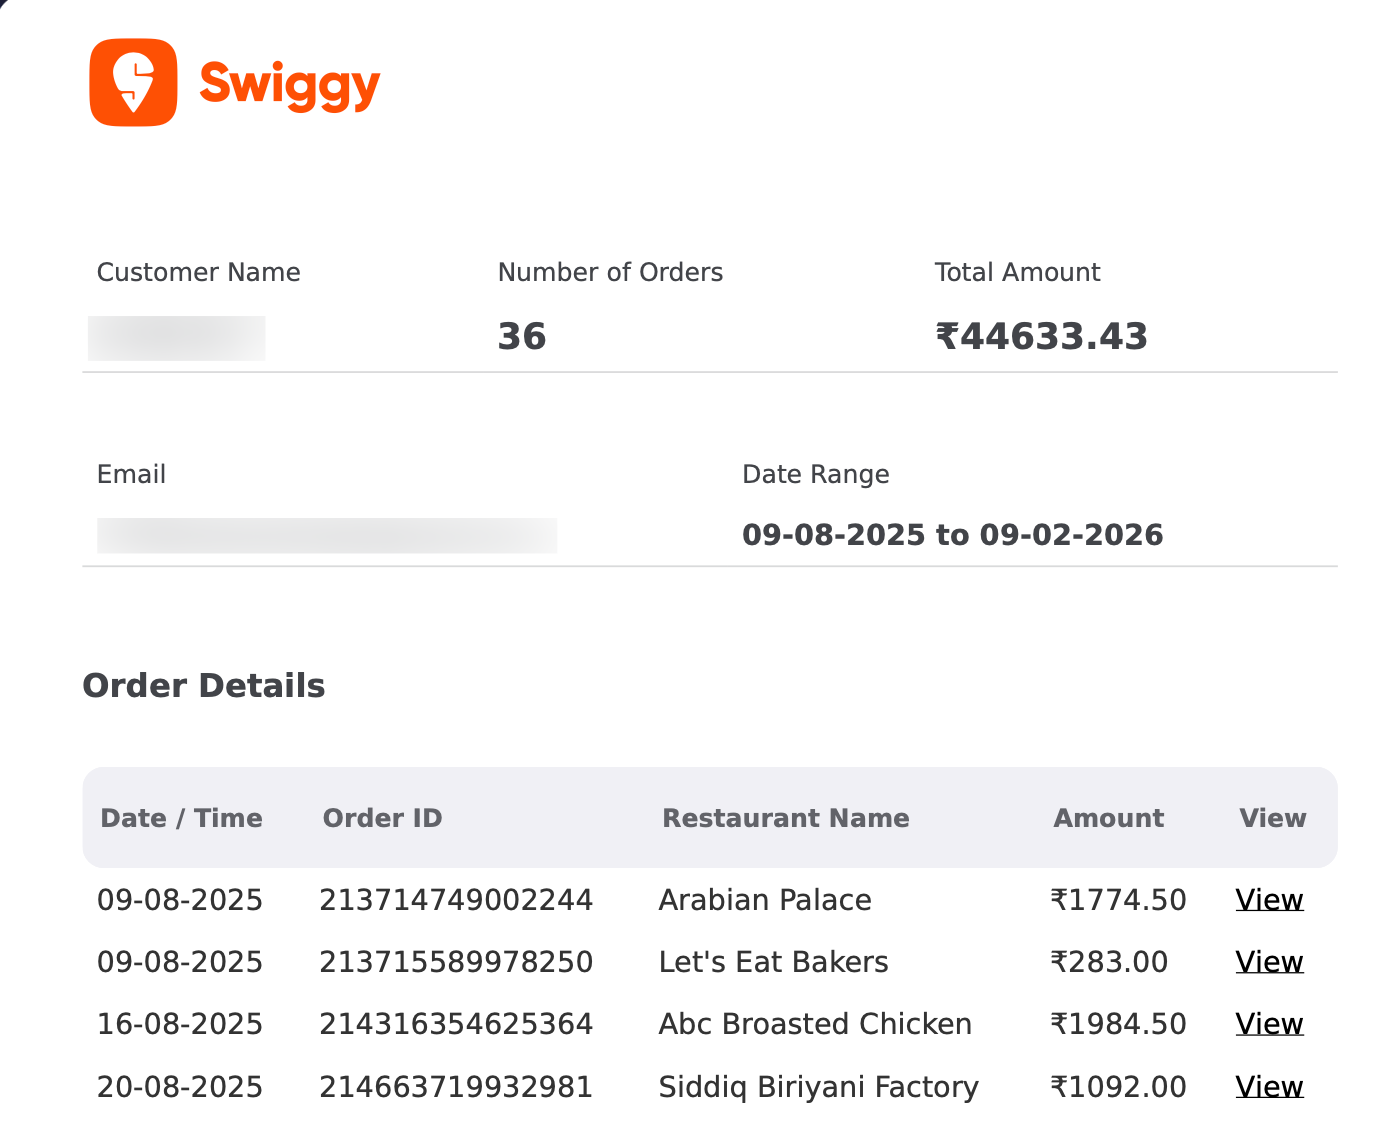
The only thing they provide is an Account Statement — a PDF report you can request from the app. You go to your profile, select a date range (maximum 6 months at a time), pick a category (Food or Instamart, separately), and wait about 3 hours for it to arrive in your email.
What you get is a summary PDF. Here’s what the food one looks like — a header with your name and totals, followed by a table of orders:
And here’s the Instamart version — same idea, different layout:
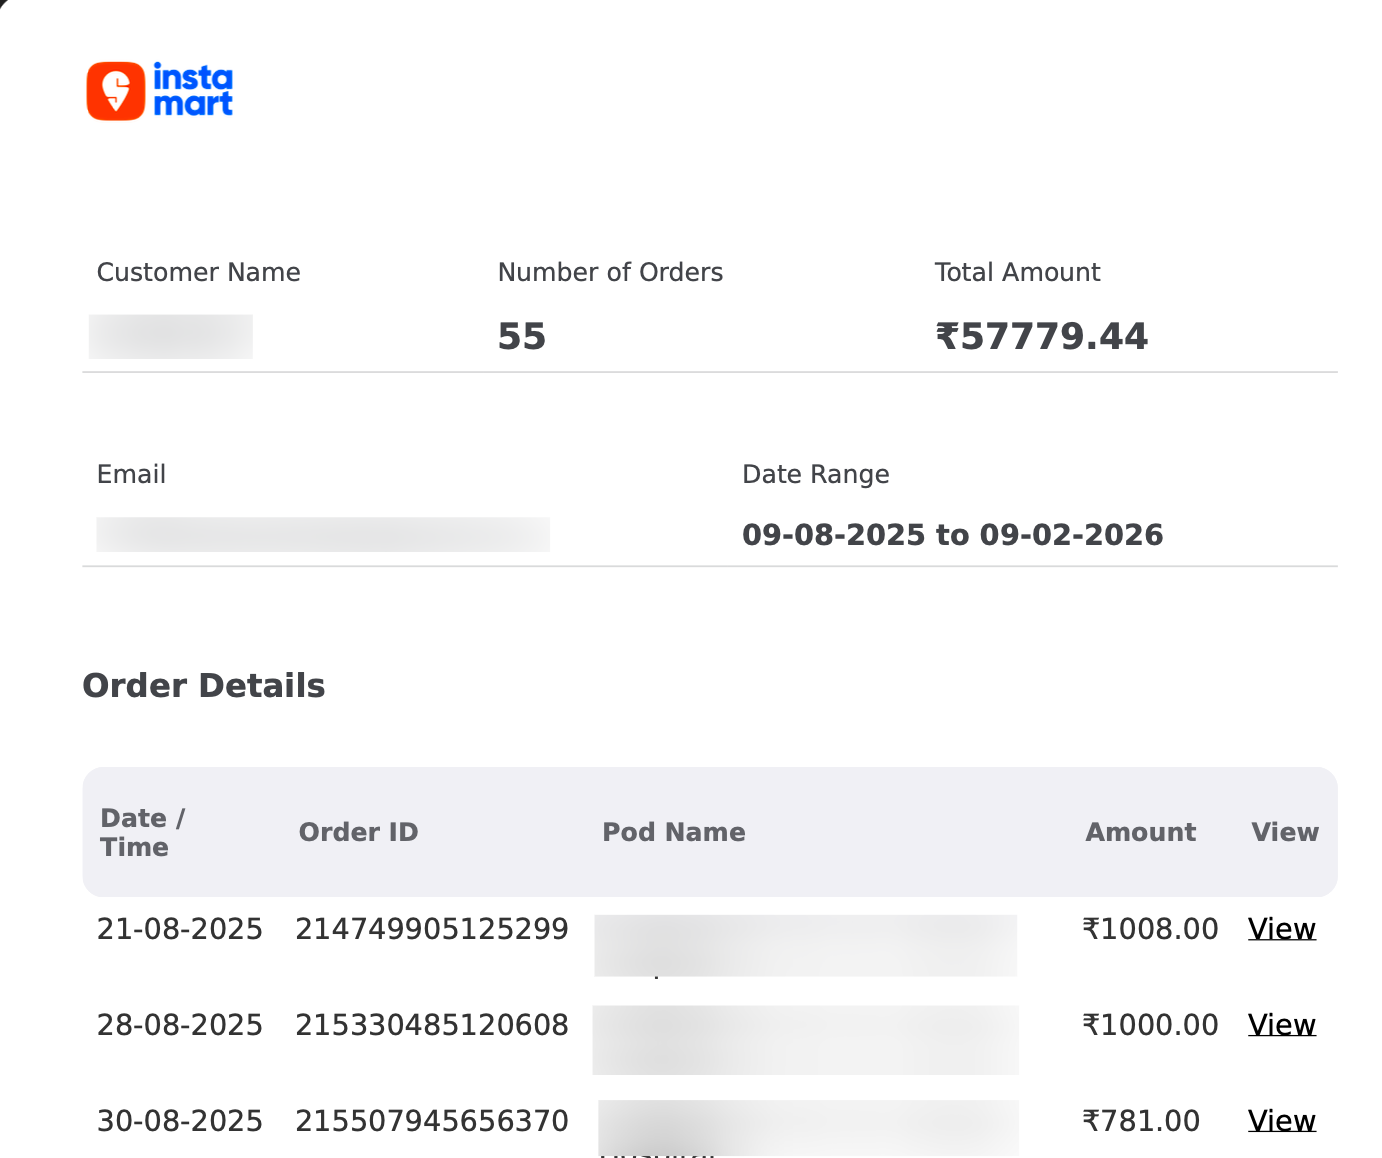
Each row has a tiny “View” link that takes you to the detailed invoice for that specific order. That’s your only way in.
A PDF. In 2026.
I sat there staring at these thinking, “Okay, I guess we’re doing this the hard way.”
The Idea
The PDF itself had structure — a header with my name, email, and date range, followed by rows of orders. Each detailed invoice (behind those “View” links) had everything I wanted: item names, quantities, prices, discounts, tax breakdowns (CGST, SGST, Cess), HSN codes, handling fees, even the restaurant’s GSTIN and FSSAI numbers.
All the data was there. Just locked inside PDFs.
So I thought — what if I could:
- Parse the summary PDF to get the list of orders
- Automatically follow every “View” link to download each detailed invoice
- Parse all those detail PDFs to extract every field
- Load everything into a proper database
- Build dashboards to actually visualize my spending
That became SwiggyIt.
How It Works
The pipeline is straightforward:
Step 1 — You request your account statements from the Swiggy app (Food and Instamart separately) and drop the PDFs into an input/ folder.
Step 2 — SwiggyIt reads the summary PDF, extracts the customer info from the header, and pulls out every order row along with the embedded hyperlink URLs pointing to the detailed invoices.
Step 3 — It downloads all the detail PDFs automatically. These are the full invoices with itemized breakdowns, taxes, and everything else.
Step 4 — Each detail PDF gets parsed — food invoices and instamart invoices have completely different layouts, so there are separate parsers for each.
Step 5 — Everything gets loaded into PostgreSQL with proper upsert logic. You can re-run it safely any number of times without duplicating data.
Step 6 — Open Grafana and explore 30+ pre-built panels.
The whole thing runs with a single docker compose up -d. That’s it.
The Eye-Opener — ₹1.14 Lakhs in 6 Months
This is the moment that made me sit back in my chair.

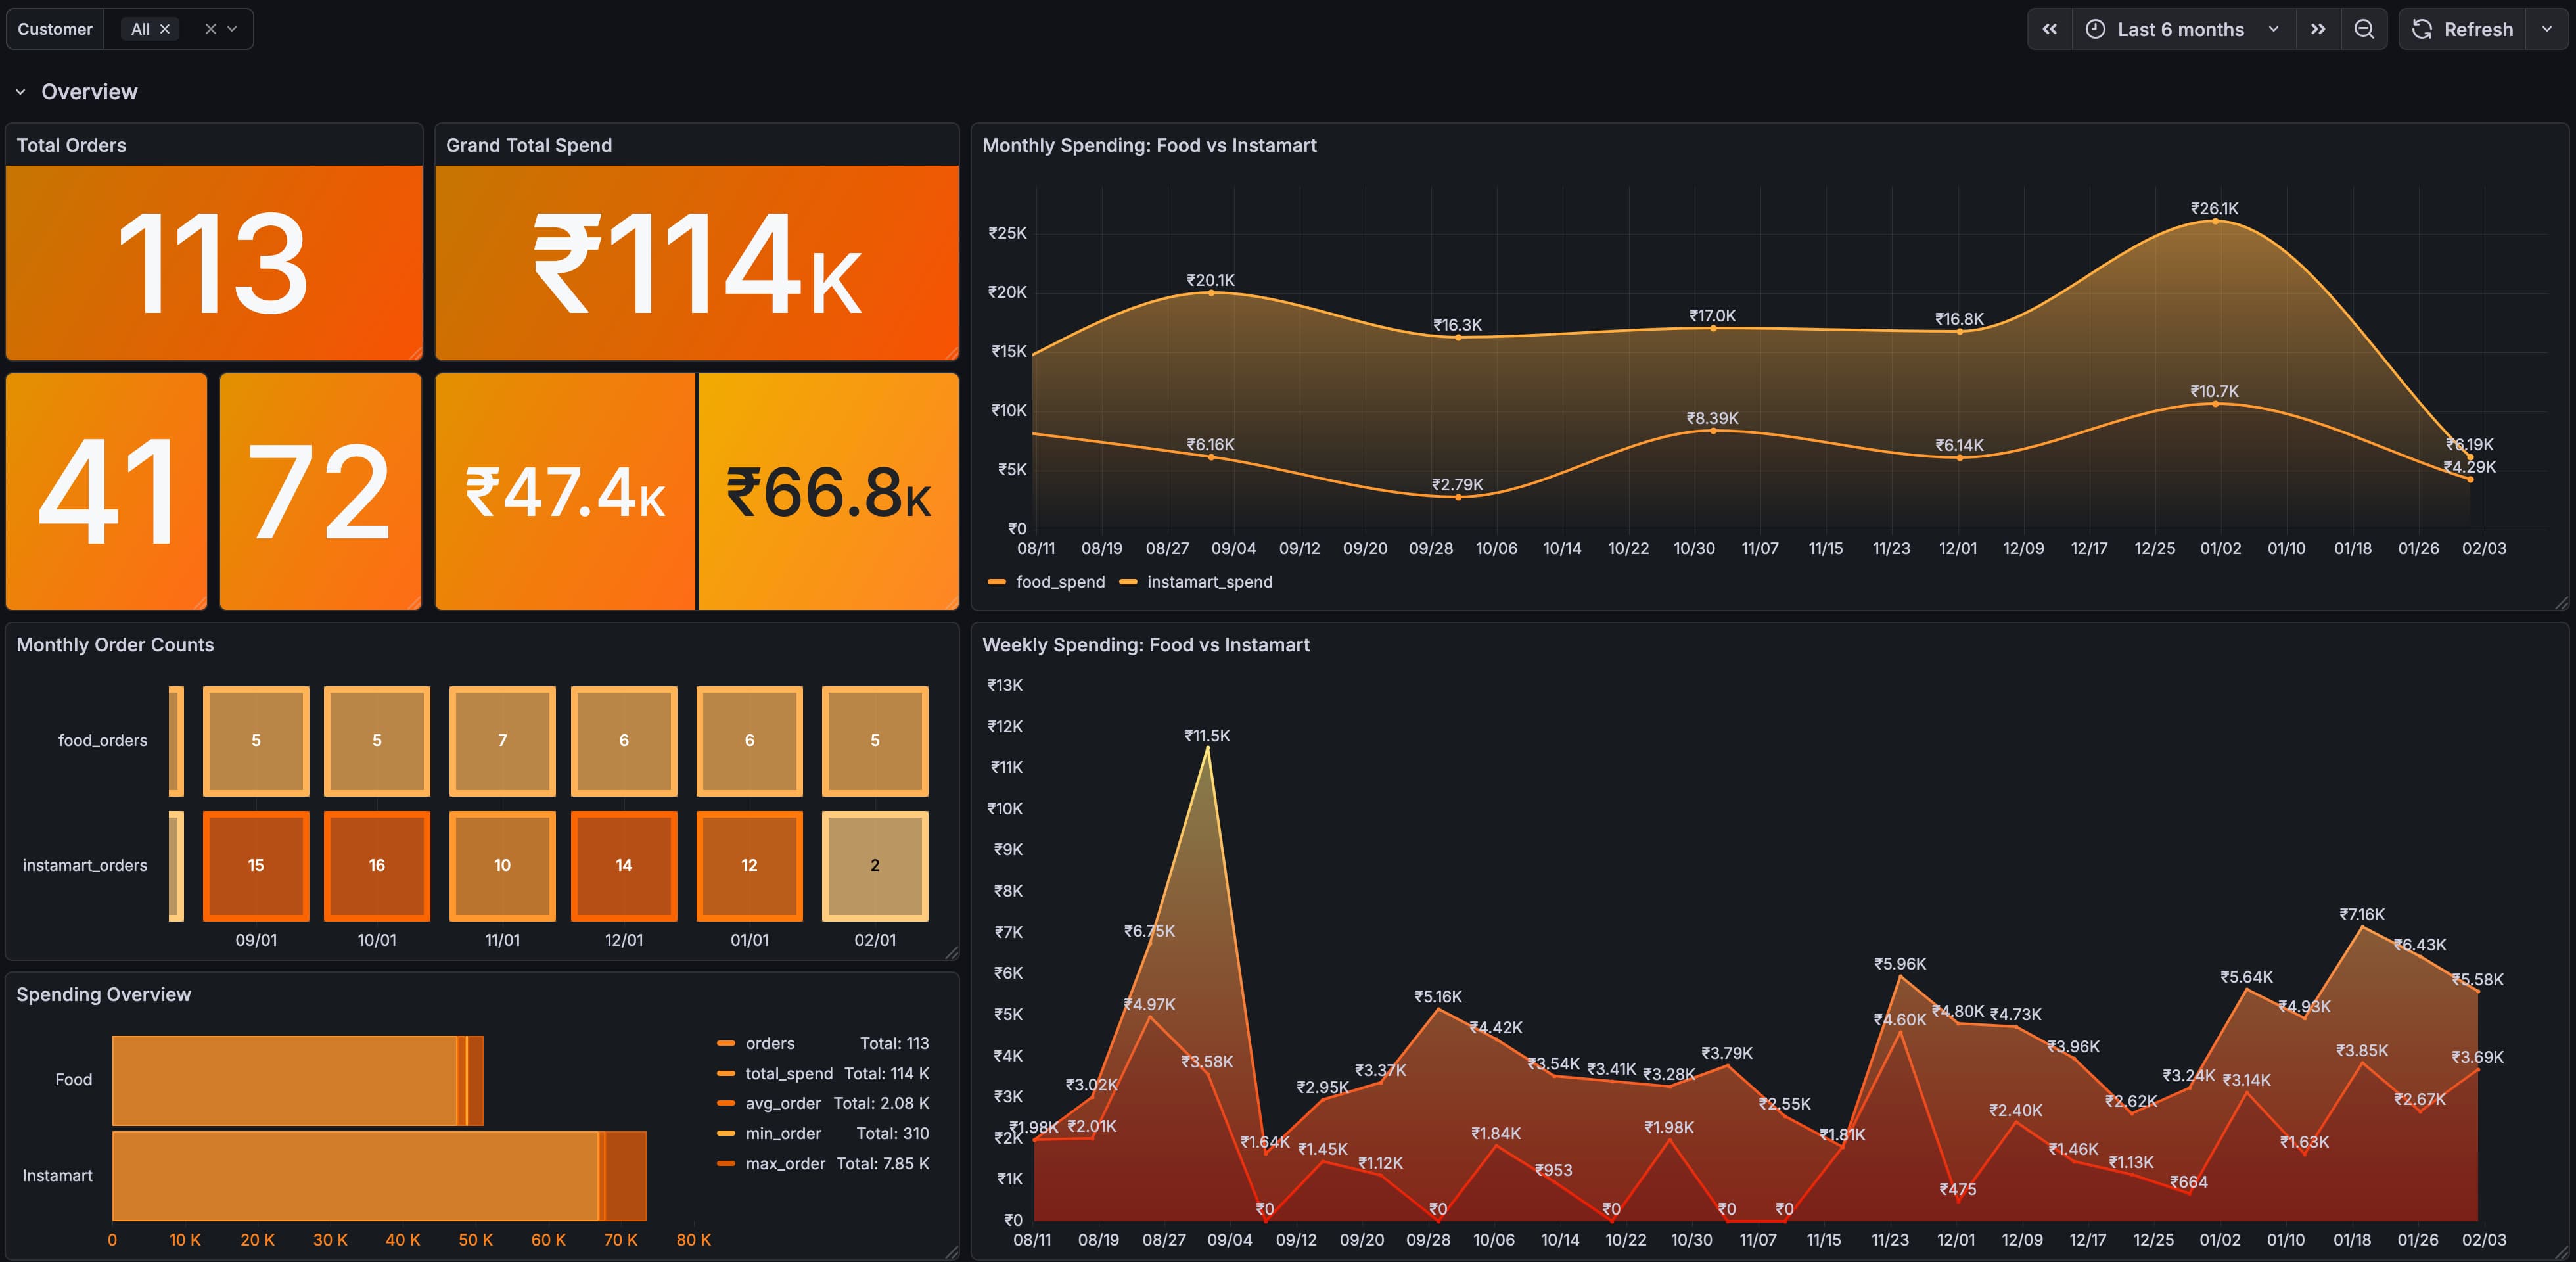
113 orders. ₹1.14 Lakhs. In just 6 months.
That’s roughly ₹19,000 per month on Swiggy alone — split between ₹47.4K on food delivery (41 orders) and ₹66.8K on Instamart groceries (72 orders). I knew I was ordering regularly, but seeing that single number on screen hit different.
The monthly and weekly trend charts made it even clearer. Some months I was spending way more than others — usually around festivals or busy work weeks when cooking felt impossible. The weekly view showed spending spikes I couldn’t explain until I thought about it.
If nothing else, just this one screen justified the whole project.
Digging Deeper — Food Analysis
Once I got over the initial shock, I started exploring.
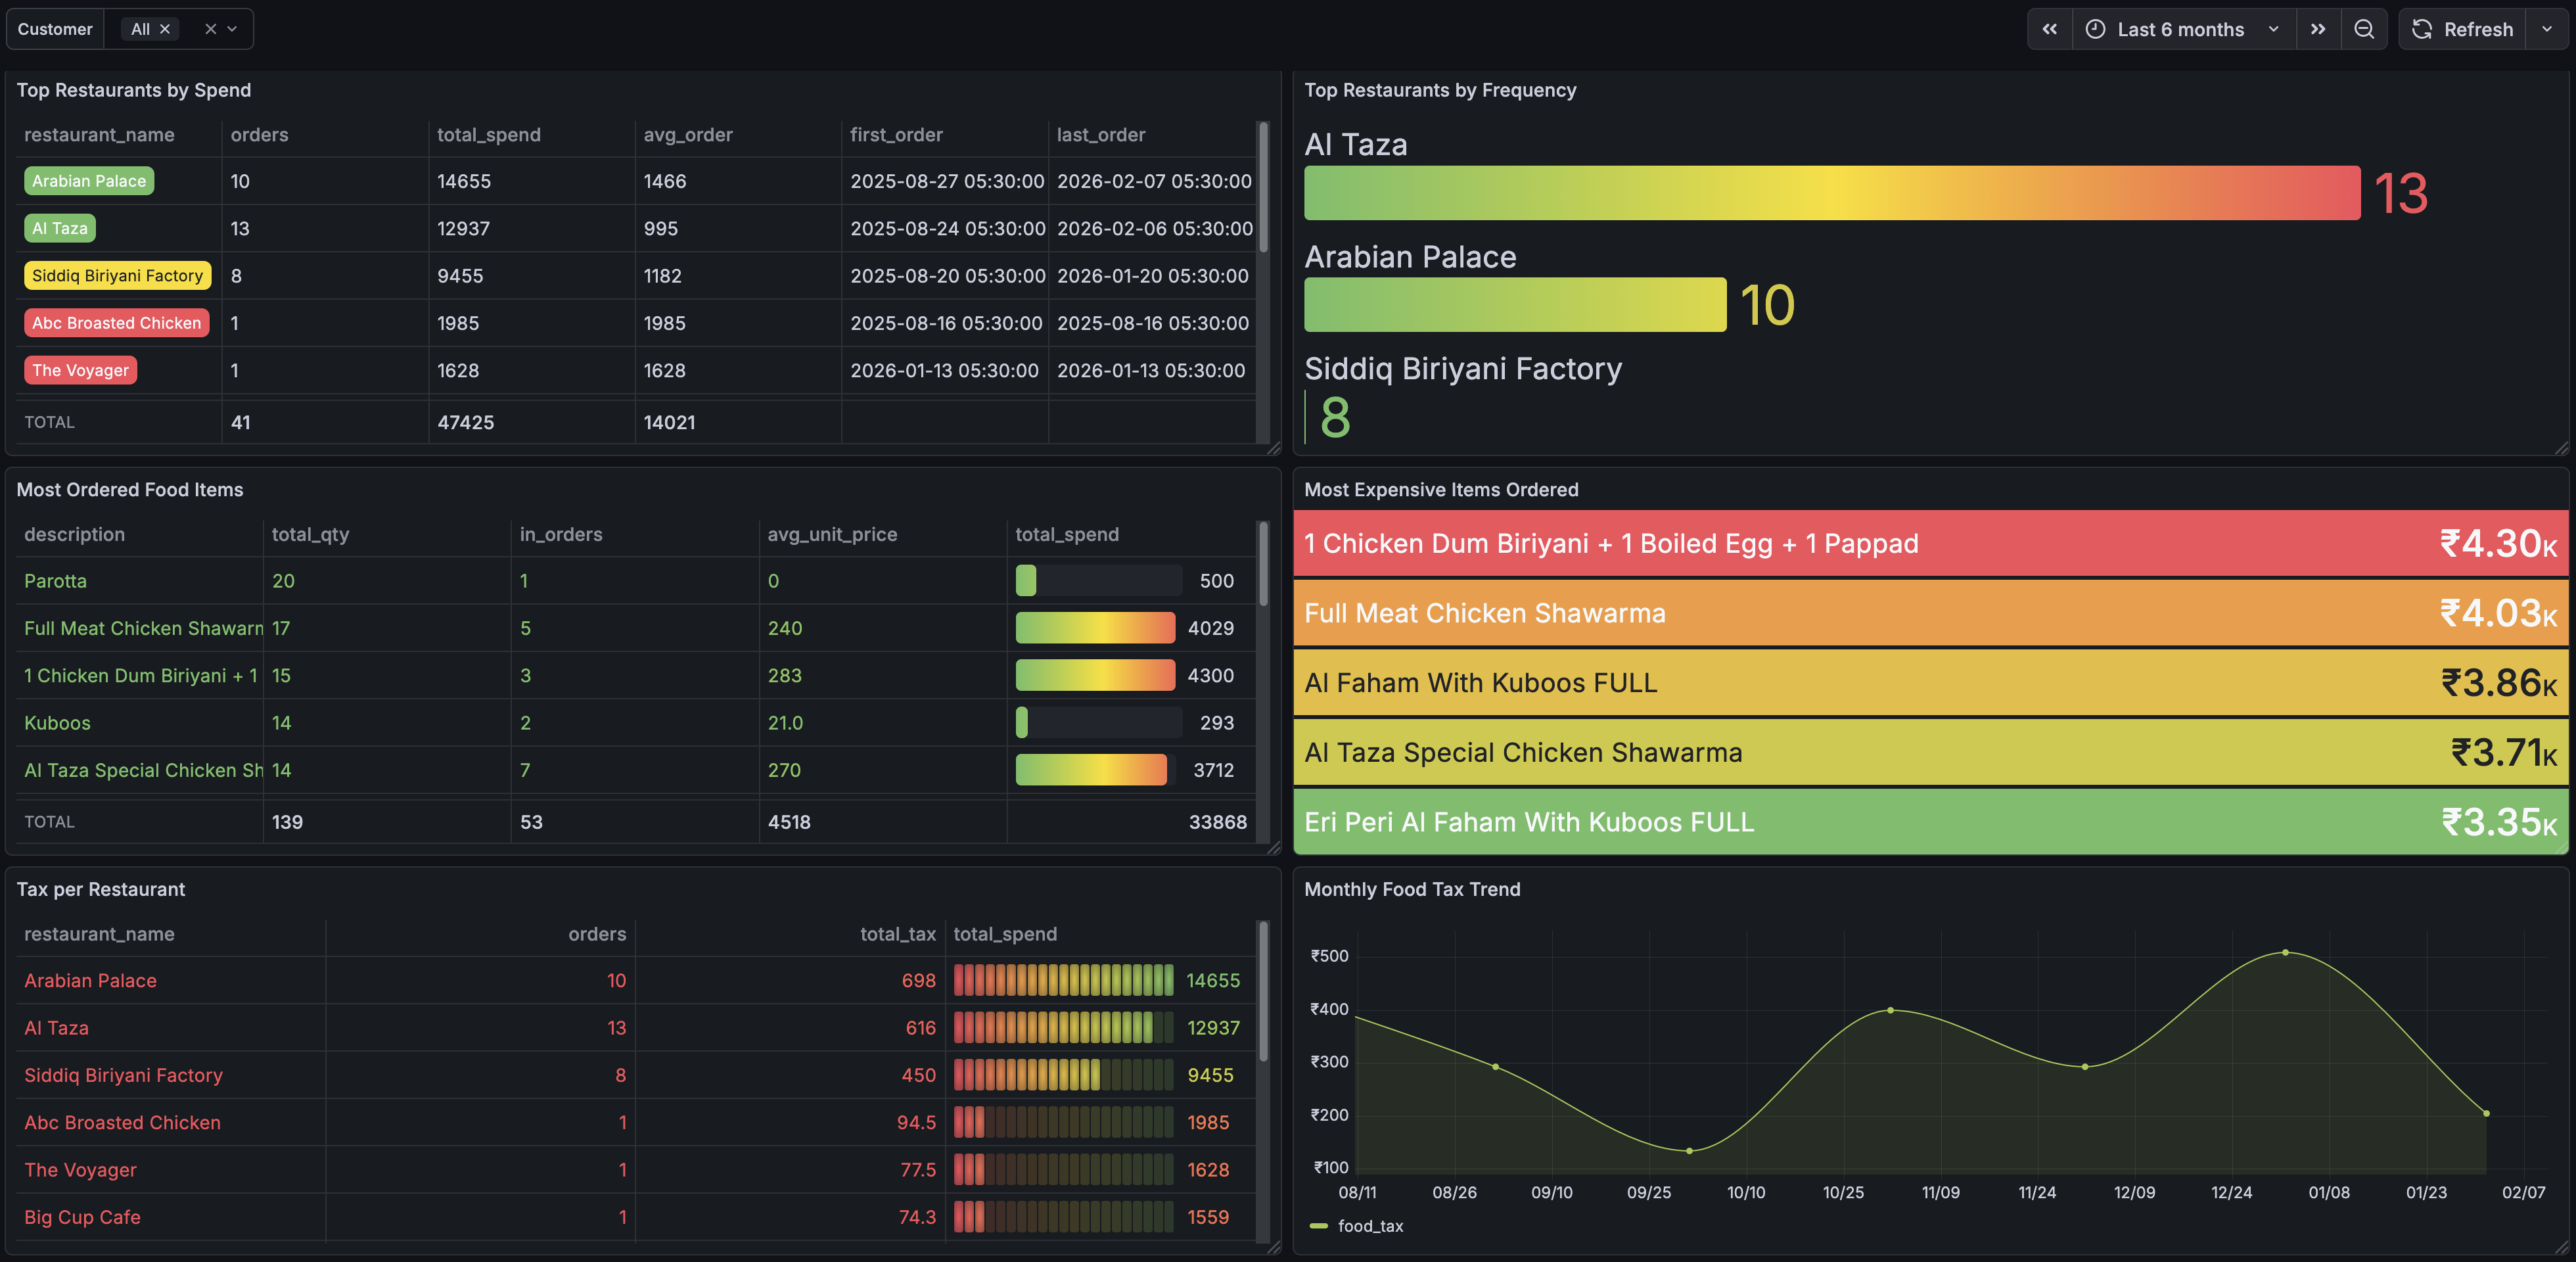
Turns out Al Taza is my most visited restaurant with 13 orders in 6 months, followed by Arabian Palace (10) and Siddiq Biriyani Factory (8). I had a feeling I was a regular, but I didn’t realize how much of a regular.
The “Most Expensive Orders” panel was fun — my priciest single food order was ₹4,300 (a Chicken Dum Biryani party order with boiled eggs and papad). The “Most Ordered Items” list was exactly what I expected — Chicken Dum Biryani at the top, followed by shawarma variations.
There’s also a tax breakdown per restaurant and a monthly tax trend. I never paid attention to how much tax I was paying per order, but seeing the cumulative numbers across hundreds of orders was genuinely eye-opening.
Instamart — The Hidden Costs
The Instamart dashboard revealed something I wasn’t expecting.
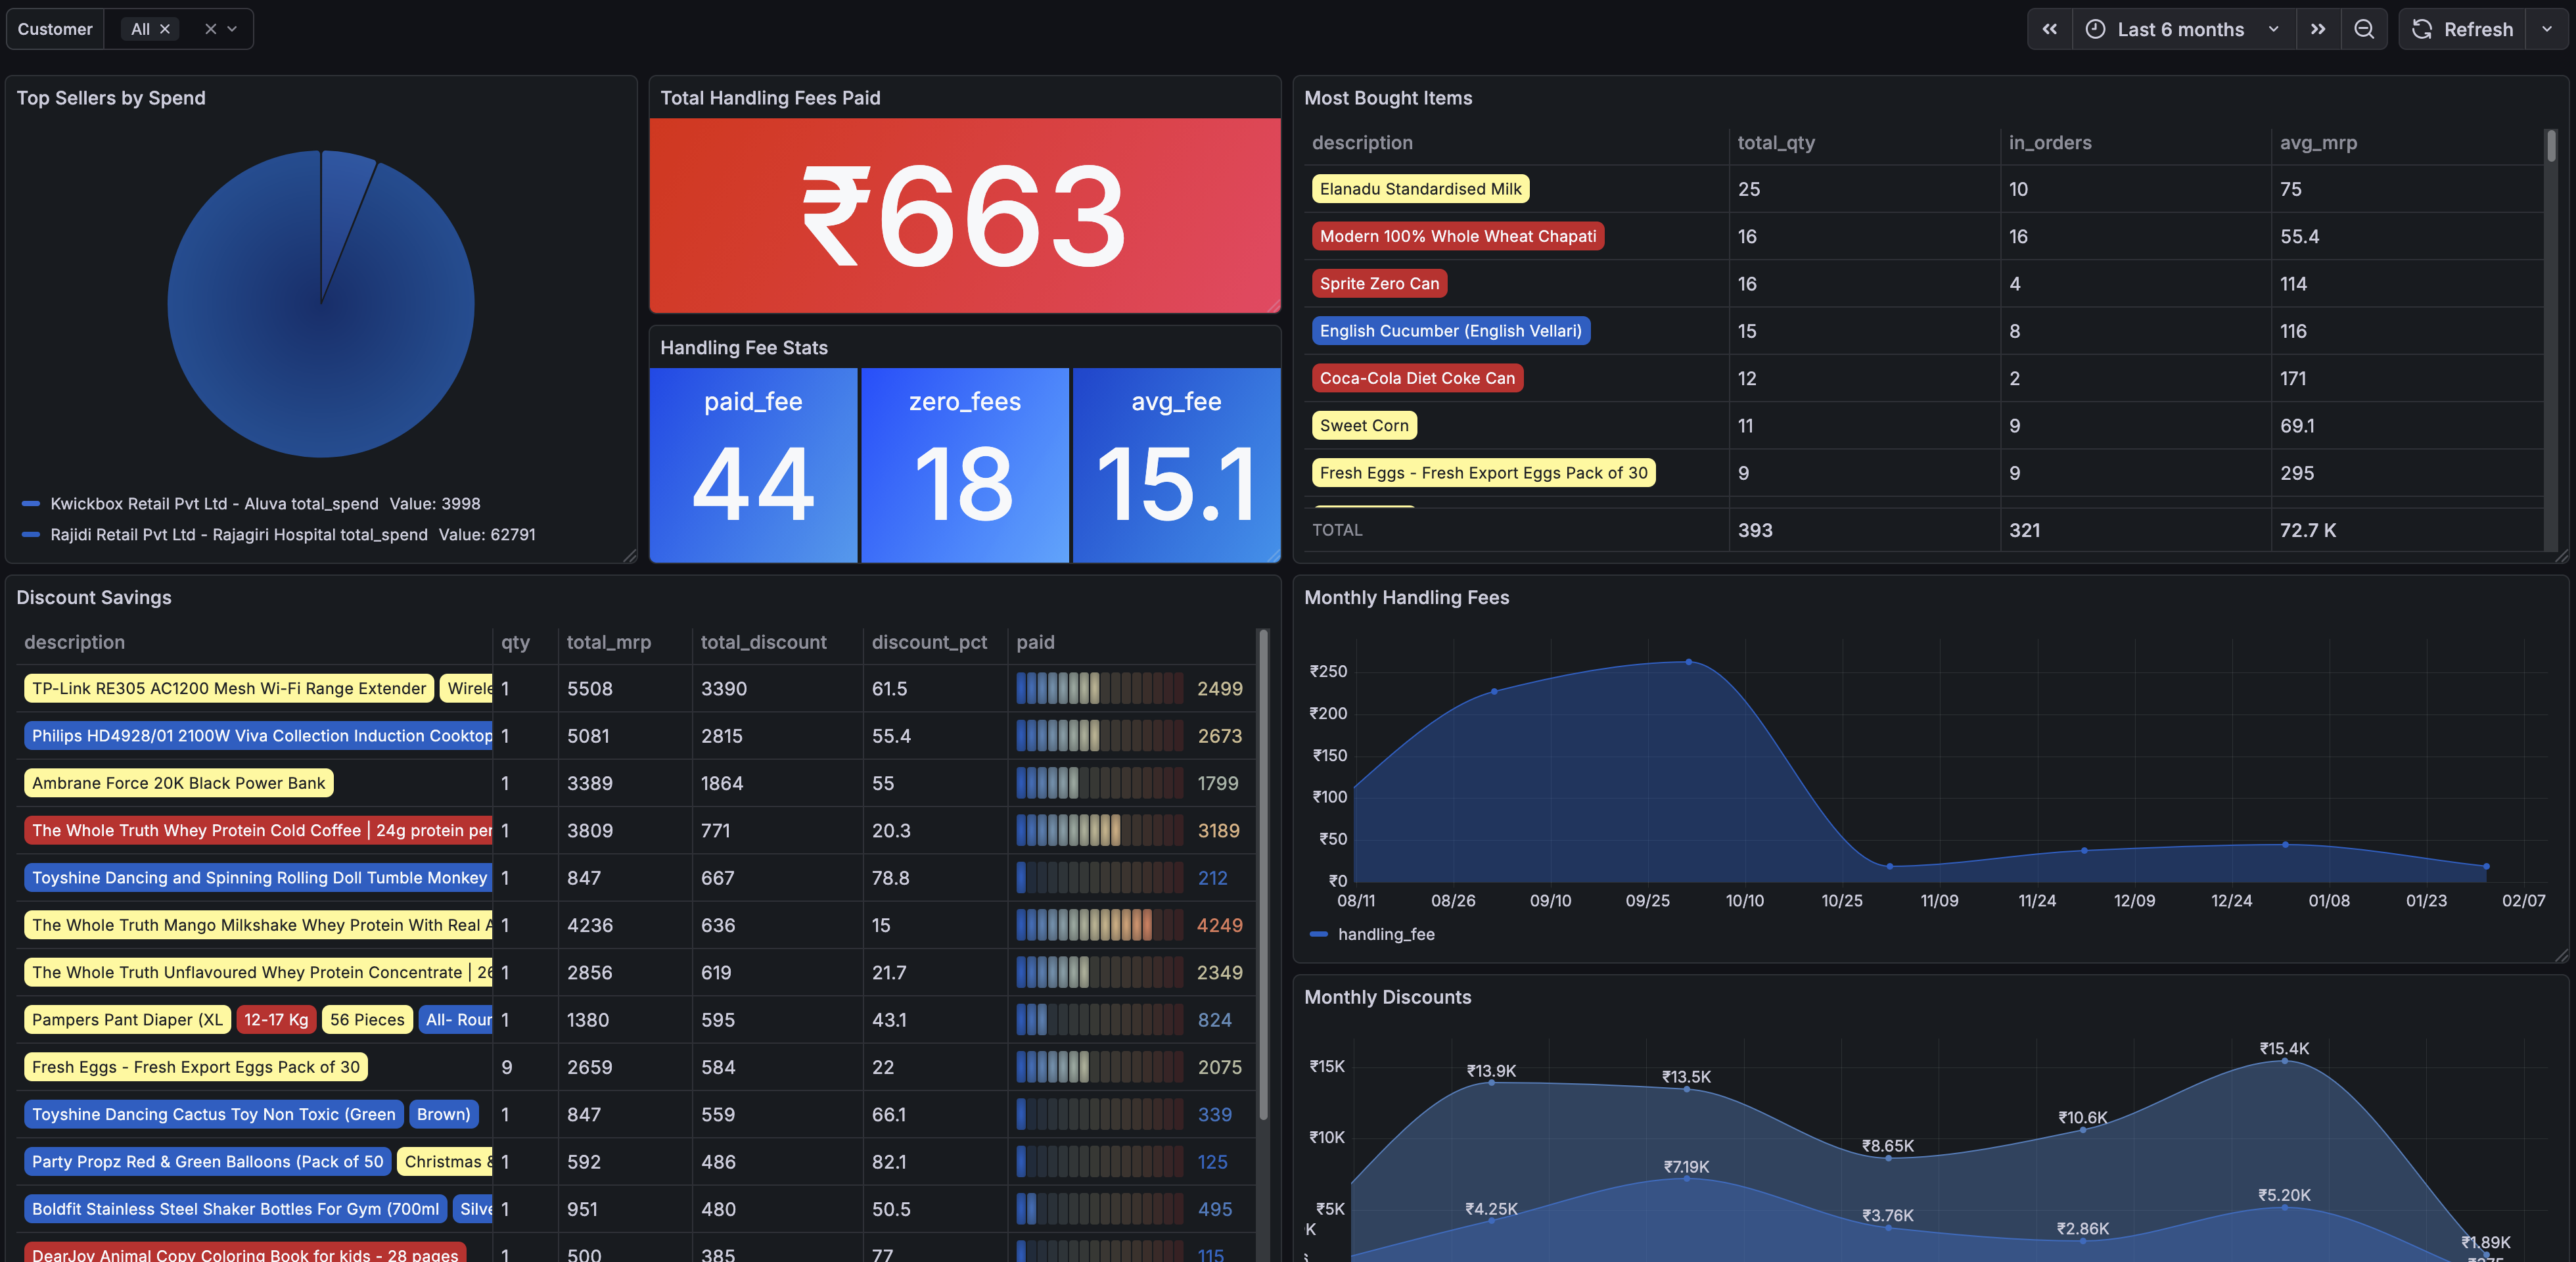
₹663 in handling fees alone. Out of 62 orders with handling fee data, 44 had a fee charged and only 18 were fee-free. The average handling fee was ₹15 per order — doesn’t sound like much until you see it piling up month after month.
The “Most Bought Items” panel was a nice reality check — tomatoes, Sprite, dahi, cucumber, eggs. The everyday essentials I kept ordering in small quantities instead of buying in bulk.
The discount savings section showed where I actually saved money, and the monthly trends made it clear — I could cut the handling fees significantly by just ordering less frequently with bigger carts. Two well-planned Instamart orders per month instead of eight small ones.
Spending Patterns — When Do I Order?
This was the most interesting dashboard to just stare at.
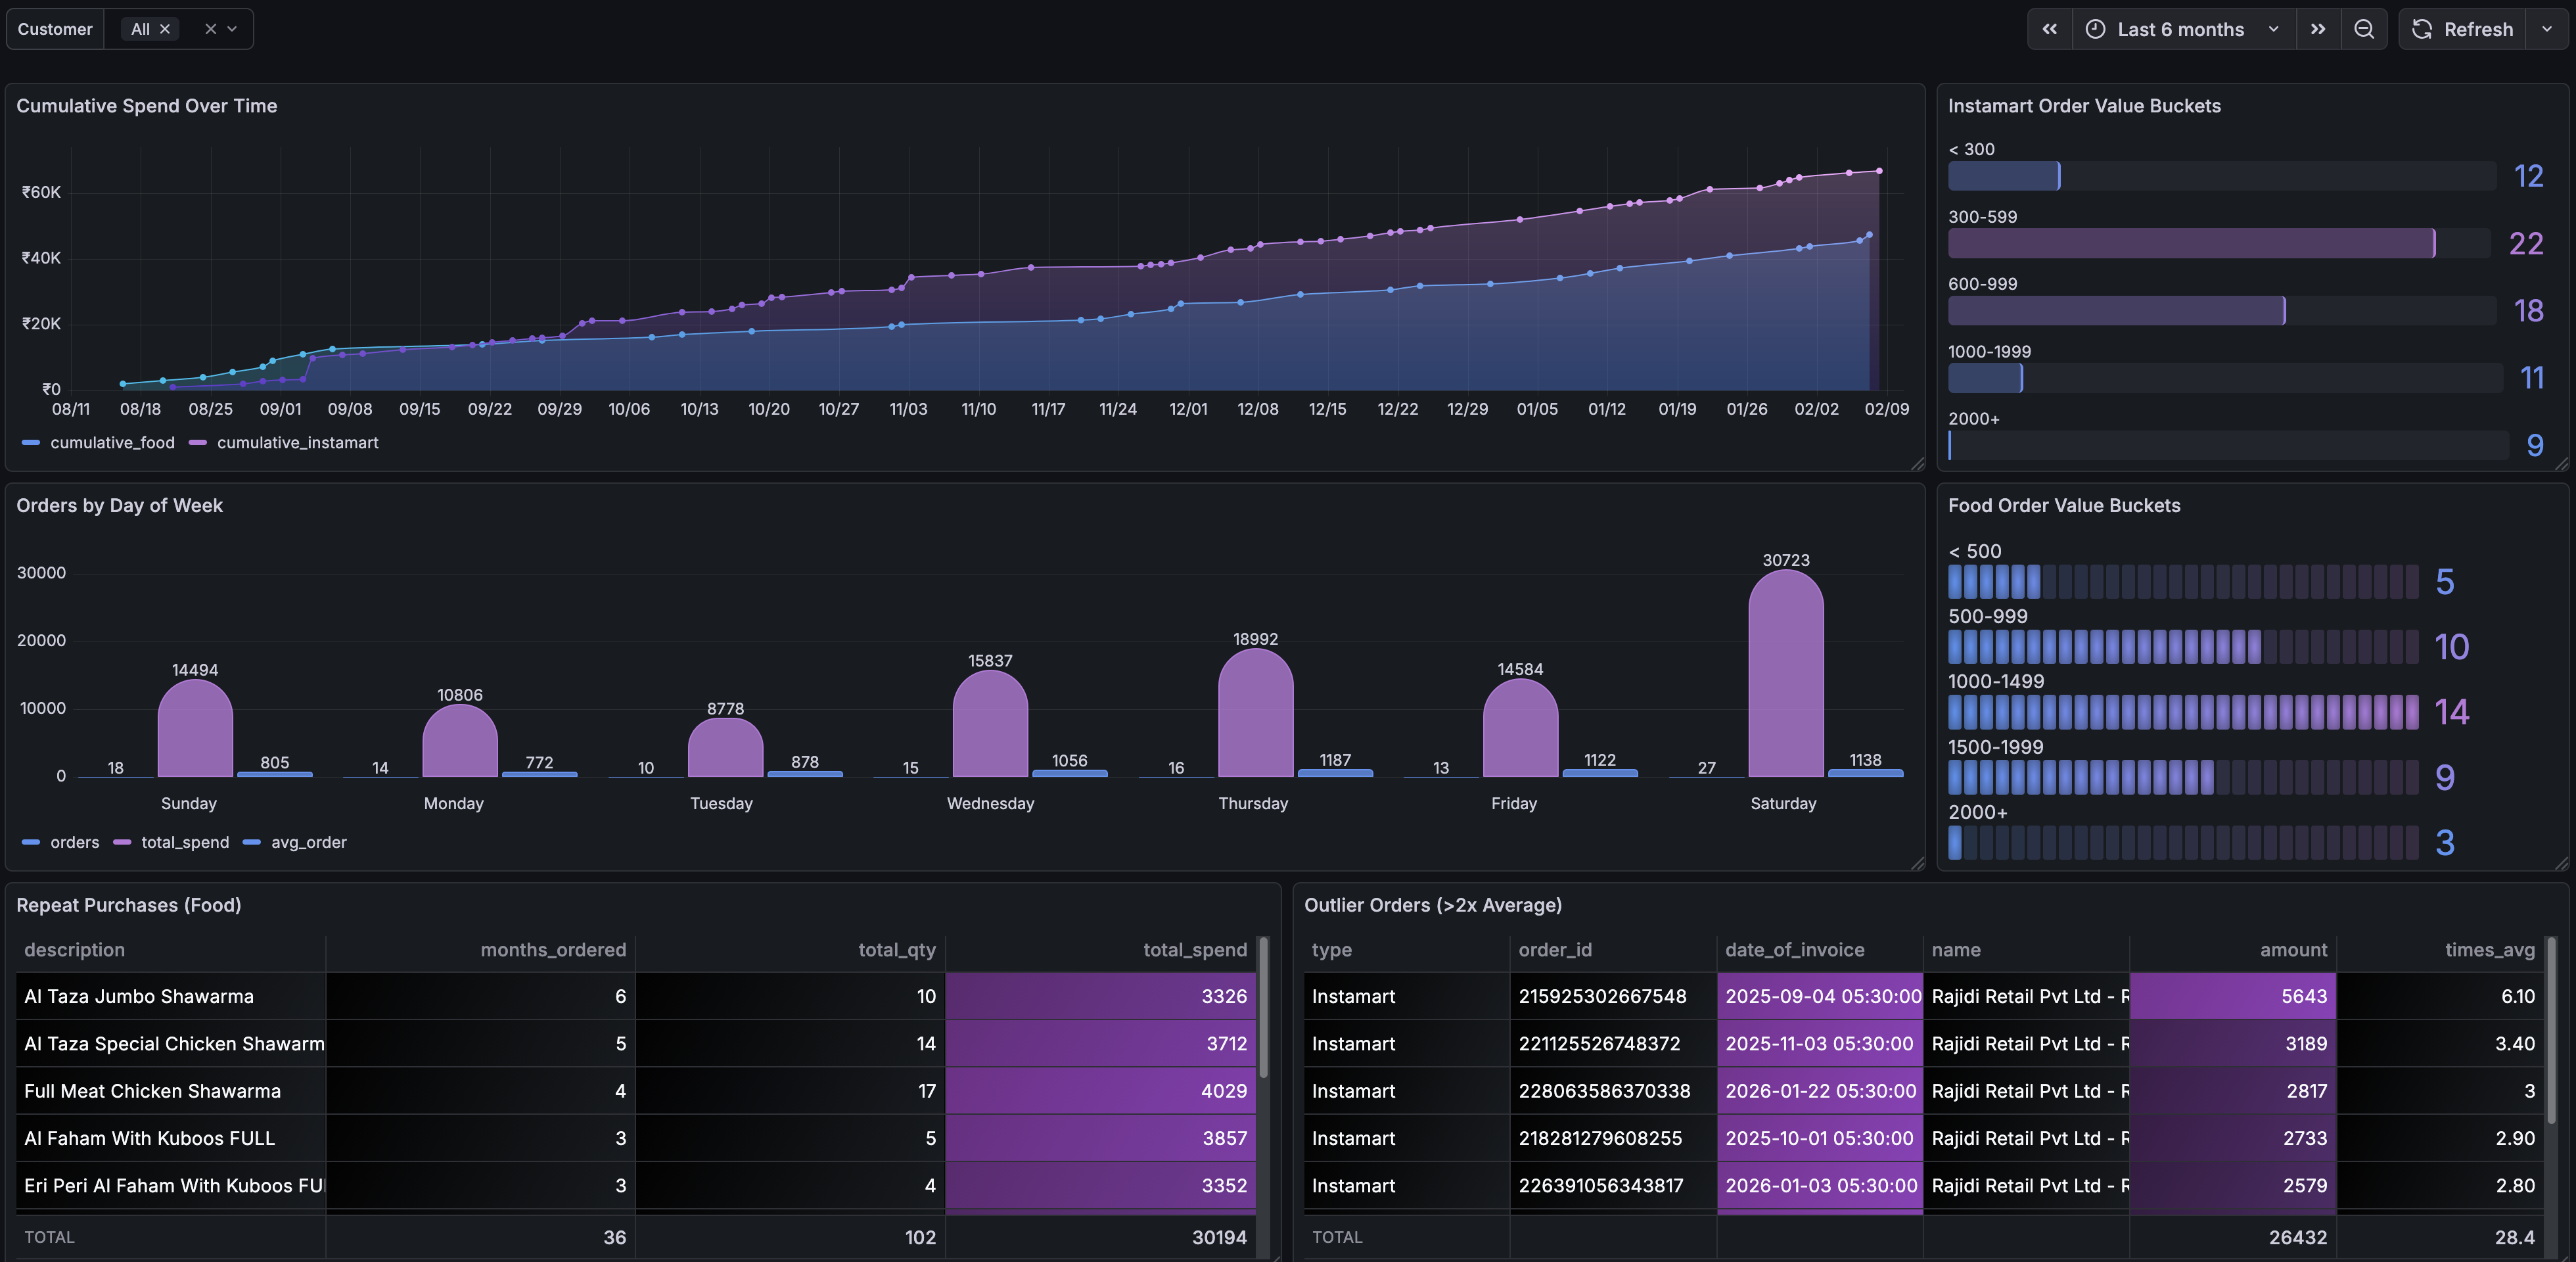
The cumulative spend chart shows the money just climbing steadily — food and instamart stacking up over time. The “Orders by Day of Week” panel was interesting — Saturdays top the chart (no surprise there), but Thursdays come in second, followed closely by Wednesdays. Midweek spending almost matching weekends? That one caught me off guard.
The order value distribution buckets show most of my food orders fall in the ₹500-1500 range, while Instamart orders cluster around ₹500-1000. The repeat purchases panel confirmed my Al Taza Jumbo Shawarma addiction — 6 times in 6 months.
And the outlier detection panel flagged a few unusually large orders I’d completely forgotten about.
The Annoying Parts (PDF Parsing)
I won’t sugarcoat it — parsing PDFs is not fun.
Swiggy’s food invoices and instamart invoices have completely different structures. Food invoices are relatively clean. Instamart invoices have multi-line item names, variable tax columns, handling fee sections that may or may not be present, and layouts that shift slightly depending on the number of items.
The summary PDFs also have quirks. The “Customer Name” label and the actual name are separated by a few lines in a specific pattern. Restaurant names can wrap across multiple lines. The only reliable way to detect an order row is to look for a date pattern, followed by a 15-digit order ID, then collect lines until you hit a rupee amount.
It took a fair amount of trial and error, but once the parsers were solid, they’ve been reliable.
Multiple Users? Sure.
One thing I wanted to support from the start was multiple users — so my family could use the same setup. If someone else drops their Swiggy PDFs into the input folder, SwiggyIt creates a new customer record based on the email in their PDF header. Grafana has a customer dropdown filter so you can switch between users.
The Stack
I kept it simple:
- Python for the parsing and data loading
- PostgreSQL for storage — 6 tables that capture every field from the invoices
- Grafana for dashboards — pre-configured with a provisioned datasource and a JSON dashboard, so it just works out of the box
- Docker Compose to tie it all together
No frameworks, no web servers, no frontend. Just a CLI tool that reads PDFs and puts data in a database, and Grafana to look at it.
Running It Yourself
If you’re curious about your own Swiggy spending, the whole thing is open source:
The README has detailed instructions, but the short version is:
git clone https://github.com/dannotes/swiggyit.git
cd swiggyit
cp .env.example .env
# Drop your Swiggy PDFs into input/food/ and input/instamart/
docker compose up -d
# Open http://localhost:3000
You’ll need Docker, your Swiggy account statement PDFs, and a few minutes. That’s about it.
Final Thoughts
This started because I wanted a number — a simple monthly total. What I ended up with is a full picture of how I spend on food delivery and groceries. ₹1.14 Lakhs in 6 months was the wake-up call I didn’t know I needed. And honestly, just having that visibility has already changed how I order.
I’m not saying everyone needs to build a PDF parser to manage their food delivery budget. But if Swiggy (or any platform, really) gave us a simple CSV export or an analytics page, none of this would have been necessary.
Until they do — there’s SwiggyIt.
Hope this helps someone out there who’s been wondering the same thing.